-
Market research is :: the process of systematically collecting, recording, and analysing information concerning a specific marketing problem.
-
Rationale:
- through analysing customer buying behaviour, a business can minimise the risk of customers disliking their products
-
- put them in a stronger competitive position
-
- through analysing customer buying behaviour, a business can minimise the risk of customers disliking their products
-
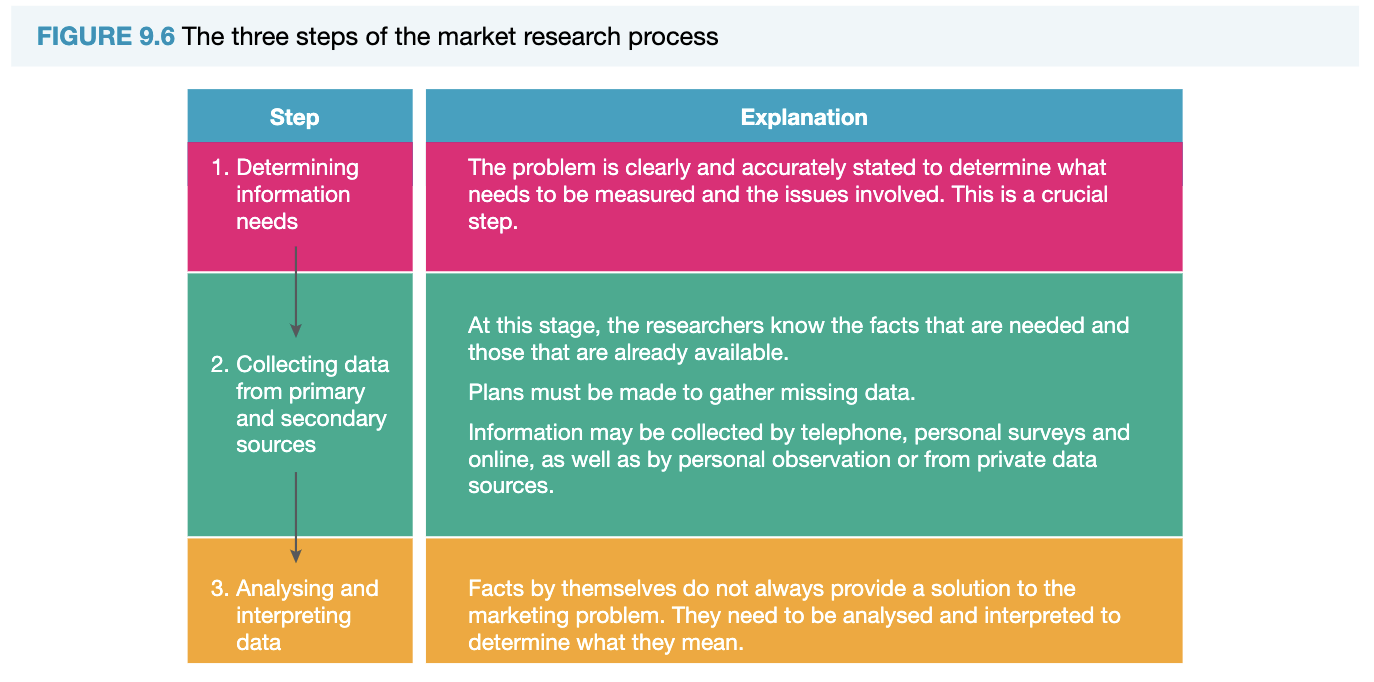
Step 1: Determining informational needs
?
- The marketing problem needs to be clearly and accurately stated to determine what needs to be measured
- hence, information collected must be relevant to the issue or problem being investigated.
- Through determining information needs, businesses are able to:
- (achieve their marketing objectives, meet customer needs, achieve profit maximisation)
Step 2: Data collection
- Marketing data refers to
? - the information relevant to the defined marketing problem.
- (two types; primary data & secondary data)
Primary data
is:
?
-
the facts and figures collected from original sources for the purpose of the specific research problem.
-
preferable as it’s collection is directed at solving a specific marketing problem.
-
but collection is often time consuming & expensive
- hence, many business outsource this.
-
The three main methods used to gather primary data:
? -
Survey : gathering data by asking or interviewing people
-
Observation : recording behaviour of customers
-
Experiment : gathering data by altering factors under controlled conditions → evaluate cause and effect.
Secondary data
is:
?
-
information that has already been collected by some other person or organisation
-
The two types of Secondary data are:
? -
Internal data : info that has already been collected by internal sources (within the business)
- (e.g. customer feedback, research reports)
-
External data : published data from external sources
- (e.g. magazines, newsletters)
- best known example: reports by the Australian Bureau of Statistics (ABS)
Step 3: Data analysis and interpretation
-
Once data is gathered, conclusions need to be drawn.
-
Statistical interpretation analysis is :: the process of focusing on the data that represents average, typical or deviations from typical patterns.
-
to draw these conclusions (Statistical interpretation analysis):
?
- tabulate the data
- (display the information in a table format)
- Cross-tabulate the different categories of data
- (make comparisons between individual categories)
- (e.g. different spending habits between high & low income earners)
- (make comparisons between individual categories)